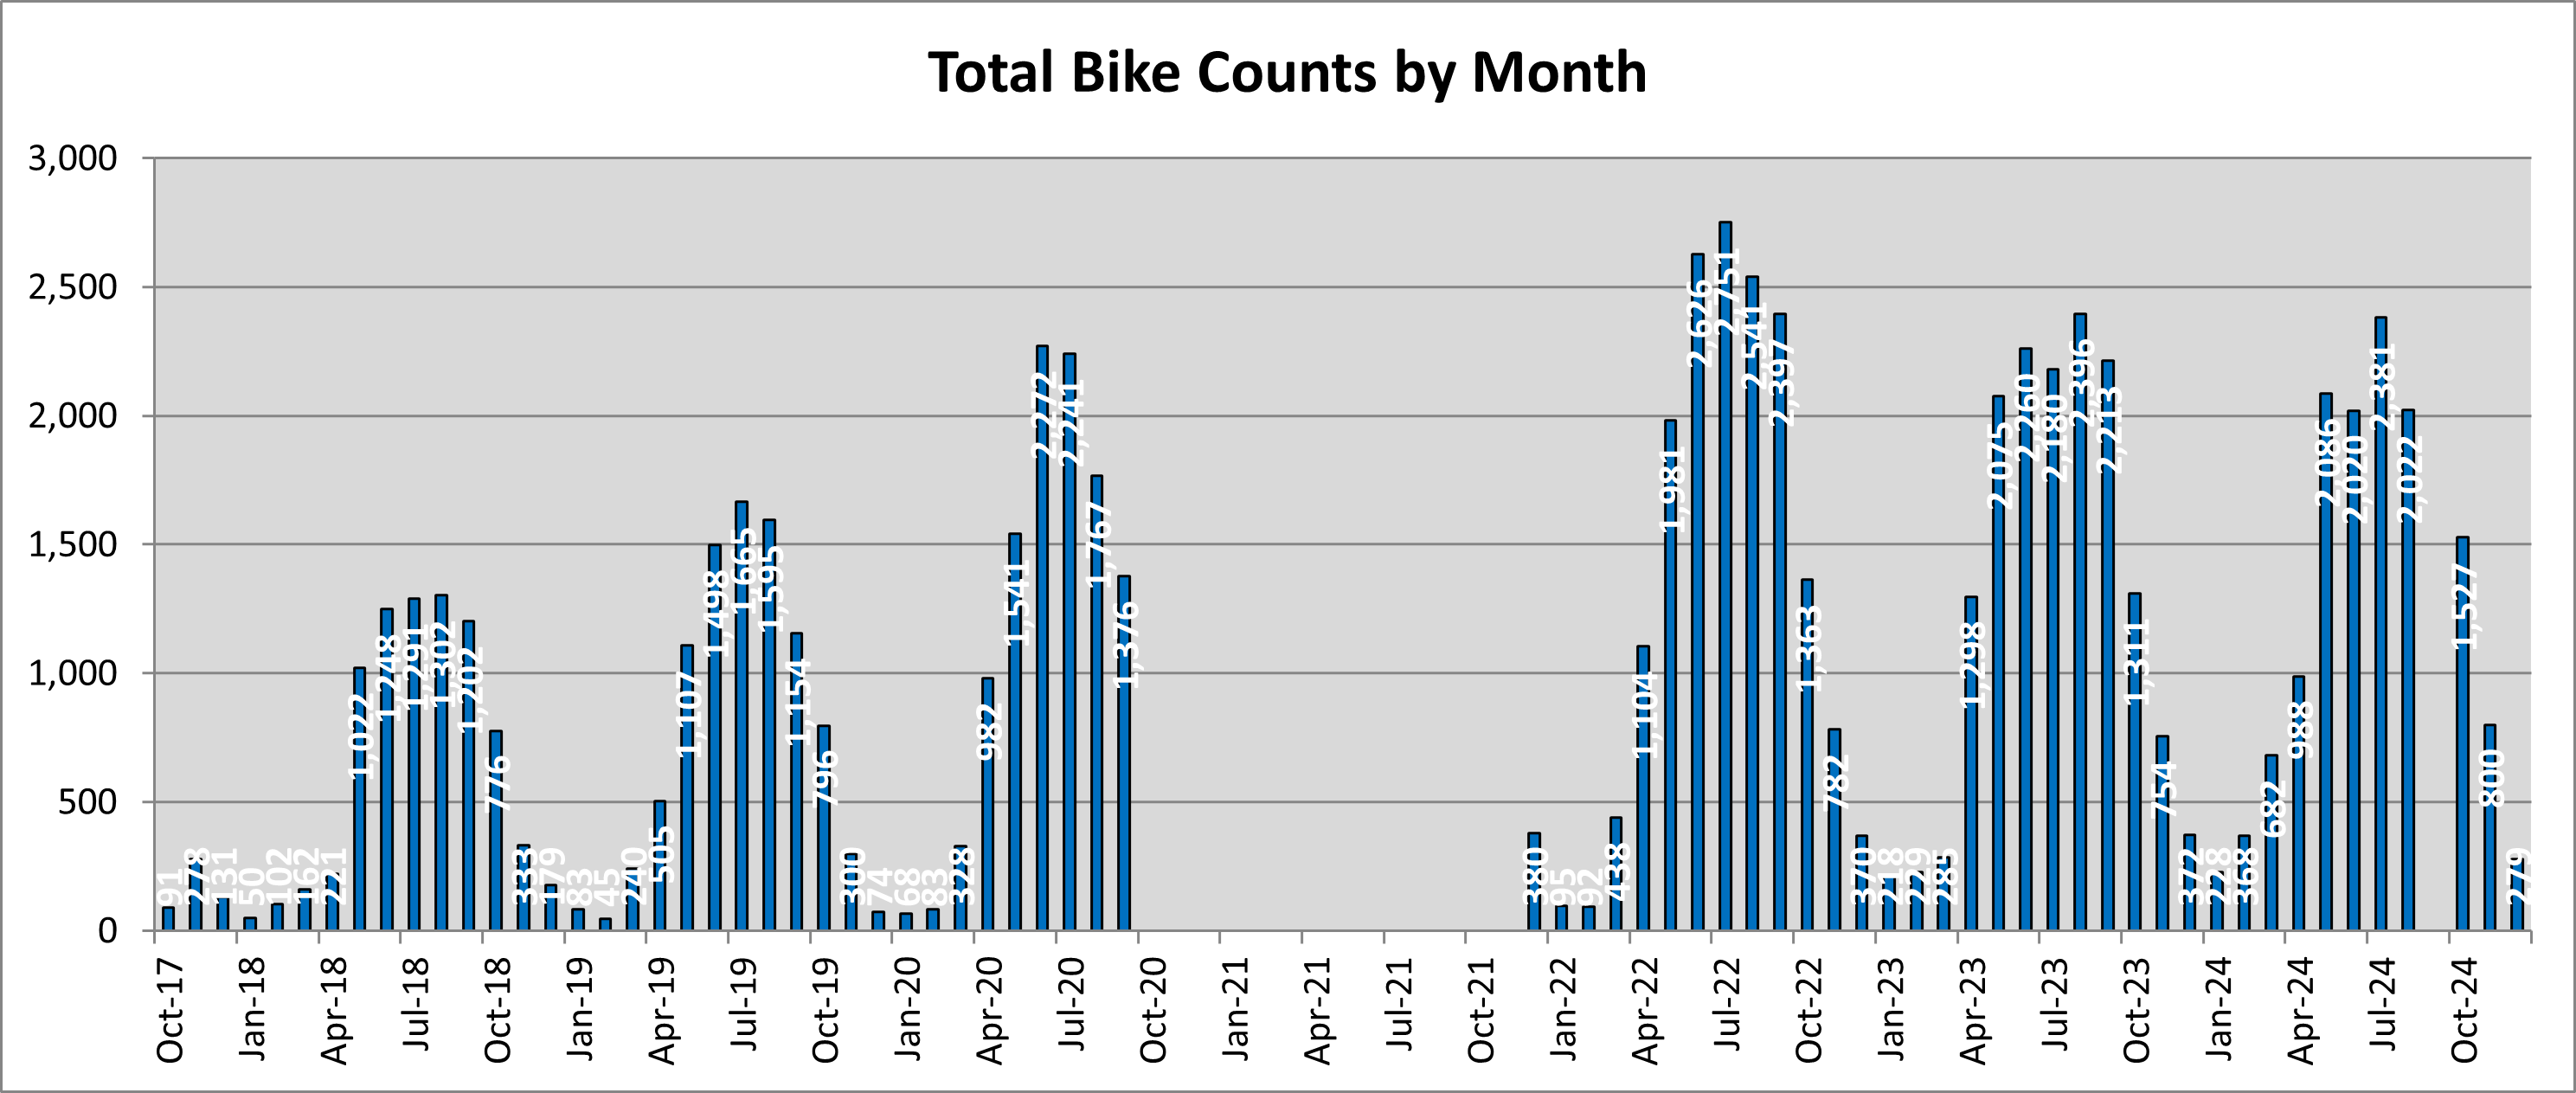
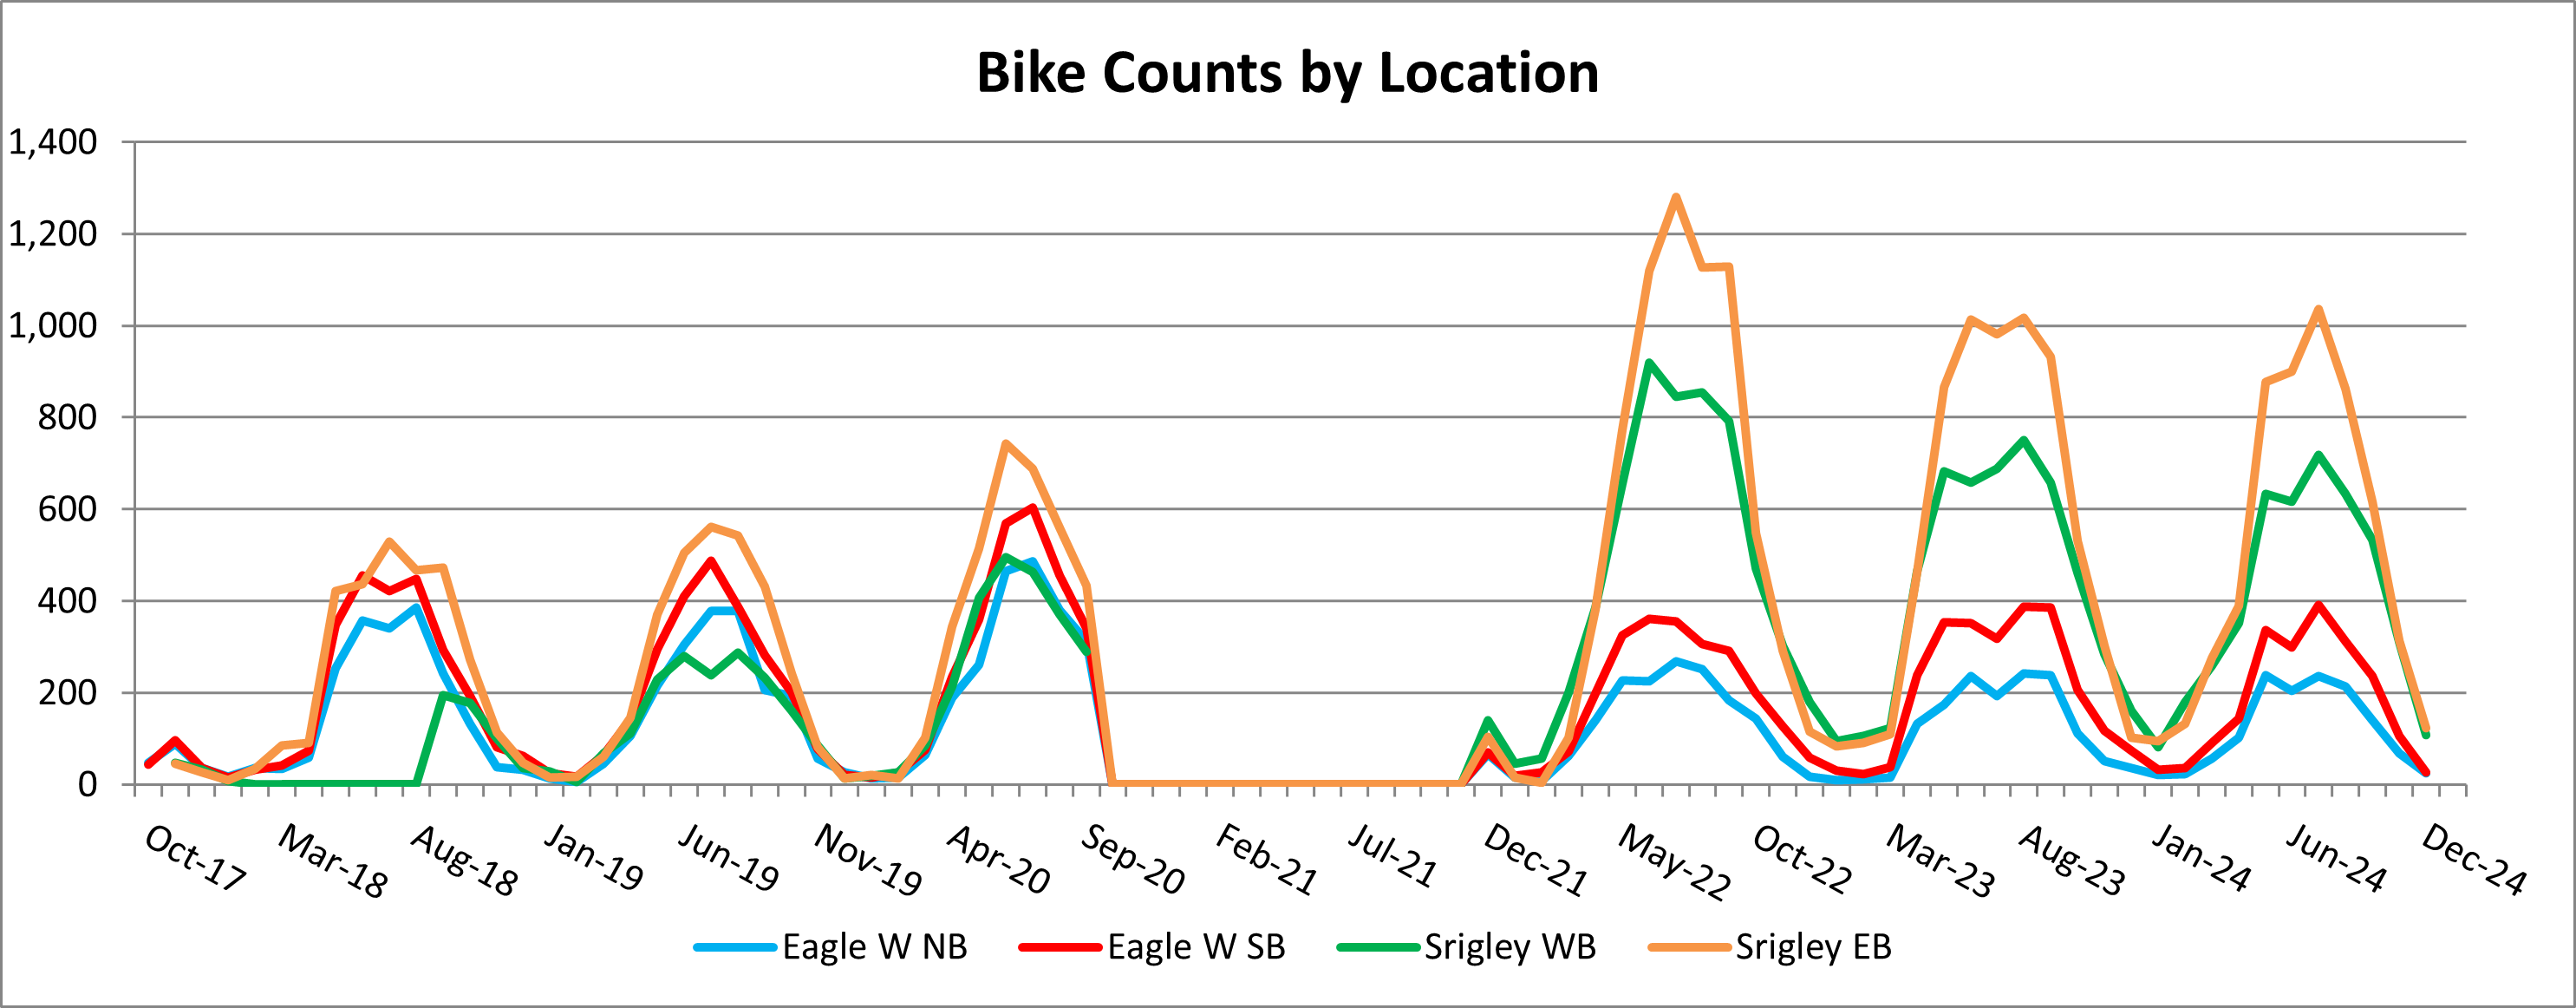
The Town of Newmarket collects and analyzes cycling volumes to monitor the usage and trends of users and to plan further bike lanes.
The Town conducted its first bicycle count in the fall of 2017 following the completion of the East-West Bikeway.
(Please note that the data between February 2018 and August 2018 from Srigley Street westbound, and the data between October 2020 and November 2021 from all locations is not available due to the sensor misinterpretation).
Month
| Eagle Street West Northbound
| Eagle Street West Southbound
| Srigley Street Westbound
| Srigley Street Eastbound
| Totals by Month
|
January 2023
| 9
| 30
| 95
| 84
| 218
|
February 2023
| 11
| 22
| 105
| 91
| 229
|
March 2023
| 16
| 37
| 123
| 109
| 285
|
April 2023
| 132
| 238
| 465
| 463
| 1,298
|
May 2023
| 174
| 353
| 682
| 866
| 2,075
|
June 2023
| 236
| 352
| 658
| 1,014
| 2,260
|
July 2023
| 192
| 318
| 689
| 981
| 2,180
|
August 2023
| 242
| 387
| 750 | 1,017
| 2,396
|
September 2023
| 238
| 385
| 658
| 932
| 2,213
|
October 2023
| 111
| 206
| 462
| 532
| 1,311
|
November 2023
| 51
| 118
| 283
| 302
| 754
|
December 2023
| 35
| 74
| 160
| 103
| 372
|
January 2024
| 21
| 32
| 81
| 94
| 228
|
February 2024
| 22 | 35
| 179
| 132
| 368
|
March 2024
| 57
| 90
| 259
| 276
| 682
|
April 2024
| 102
| 144
| 352
| 390
| 988
|
May 2024
| 239
| 336
| 633
| 878
| 2,086
|
June 2024
| 205
| 299
| 616
| 900
| 2,020
|
July 2024
| 236
| 391
| 718
| 1,036
| 2,381
|
August 2024
| 213
| 312
| 634
| 863
| 2,022
|
September 2024
| 210 | 312
| 596
| 872
| 1,990
|
October 2024
| 139
| 237
| 534
| 617
| 1,527
|
November 2024
| 69
| 106
| 311
| 314
| 800
|
2017 - 2022Month
| Eagle Street West Northbound
| Eagle Street West Southbound
| Srigley Street Westbound
| Srigley Street Eastbound
| Totals by Month
|
October 2017
| 48
| 43
| N/A
| N/A
| 91
|
November 2017
| 89
| 96
| 47
| 46
| 278
|
December 2017
| 36
| 36
| 33
| 26
| 131
|
January 2018
| 17
| 16
| 7
| 10
| 50
|
February 2018
| 36
| 32
| N/A
| 34
| 102
|
March 2018
| 34
| 42
| N/A
| 86
| 162
|
April 2018
| 58
| 73
| N/A
| 90
| 221
|
May 2018
| 253
| 347
| N/A
| 422
| 1,022
|
June 2018
| 357
| 455
| N/A
| 436
| 1,248
|
July 2018
| 341
| 421
| N/A
| 529
| 1,291
|
August 2018
| 386
| 449
| N/A
| 467
| 1,302
|
September 2018
| 242
| 293
| 194
| 473
| 1,202
|
October 2018
| 132
| 193
| 178
| 273
| 776
|
November 2018
| 38
| 82
| 100
| 113
| 333
|
December 2018
| 33
| 62
| 36
| 48
| 179
|
January 2019
| 14 | 25
| 28
| 16
| 83 |
February 2019
| 5
| 17
| 6
| 17
| 45
|
March 2019
| 46
| 64
| 69
| 61
| 240
|
April 2019
| 106
| 141
| 112
| 146
| 505
|
May 2019
| 215
| 294 | 228 | 370
| 1,107
|
June 2019
| 305
| 410
| 279
| 504
| 1,498
|
July 2019
| 378 | 488
| 238
| 561
| 1,665
|
August 2019
| 378 | 387
| 288
| 542
| 1,595
|
September 2019
| 207
| 282 | 233 | 432
| 1,154
|
October 2019
| 193 | 201
| 160
| 242
| 796
|
November 2019
| 56
| 78
| 85
| 81
| 300
|
December 2019
| 27
| 20 | 14 | 13
| 74
|
January 2020
| 13 | 16
| 18
| 21
| 68
|
February 2020
| 16
| 26
| 27
| 14
| 83
|
March 2020
| 64
| 76
| 85
| 103
| 328
|
April 2020
| 190 | 234
| 213
| 345
| 982
|
May 2020
| 261
| 359
| 406 | 515 | 1,541
|
June 2020
| 465
| 569
| 495
| 743
| 2,272
|
July 2020
| 486
| 604
| 463
| 688
| 2,241
|
August 2020
| 380
| 456
| 371
| 560
| 1,767
|
September 2020
| 312
| 341
| 290
| 433
| 1,376
|
October 2020 -
November 2021
| N/A
| N/A | N/A
| N/A
| N/A
|
December 2021
| 67 | 70
| 139
| 104
| 380
|
January 2022
| 15
| 19
| 45
| 16
| 95
|
February 2022
| 7
| 26
| 56
| 3
| 92
|
March 2022
| 63
| 72
| 201
| 102
| 438
|
April 2022
| 139
| 199
| 385
| 381
| 1,104
|
May 2022
| 226
| 325
| 656
| 774
| 1,981 |
June 2022
| 225 | 362
| 919
| 1,120
| 2,626
|
July 2022
| 269 | 355
| 846
| 1,281
| 2,751 |
August 2022
| 252
| 307
| 855
| 1,127
| 2,541
|
September 2022
| 184
| 292
| 792
| 1,129
| 2,397
|
October 2022
| 144
| 199
| 471
| 549
| 1,363
|
November 2022
| 60
| 127
| 303
| 292
| 782
|
December 2022
| 17
| 58
| 179
| 116
| 370
|
![]()
![]()
![]()